Description

Actual values
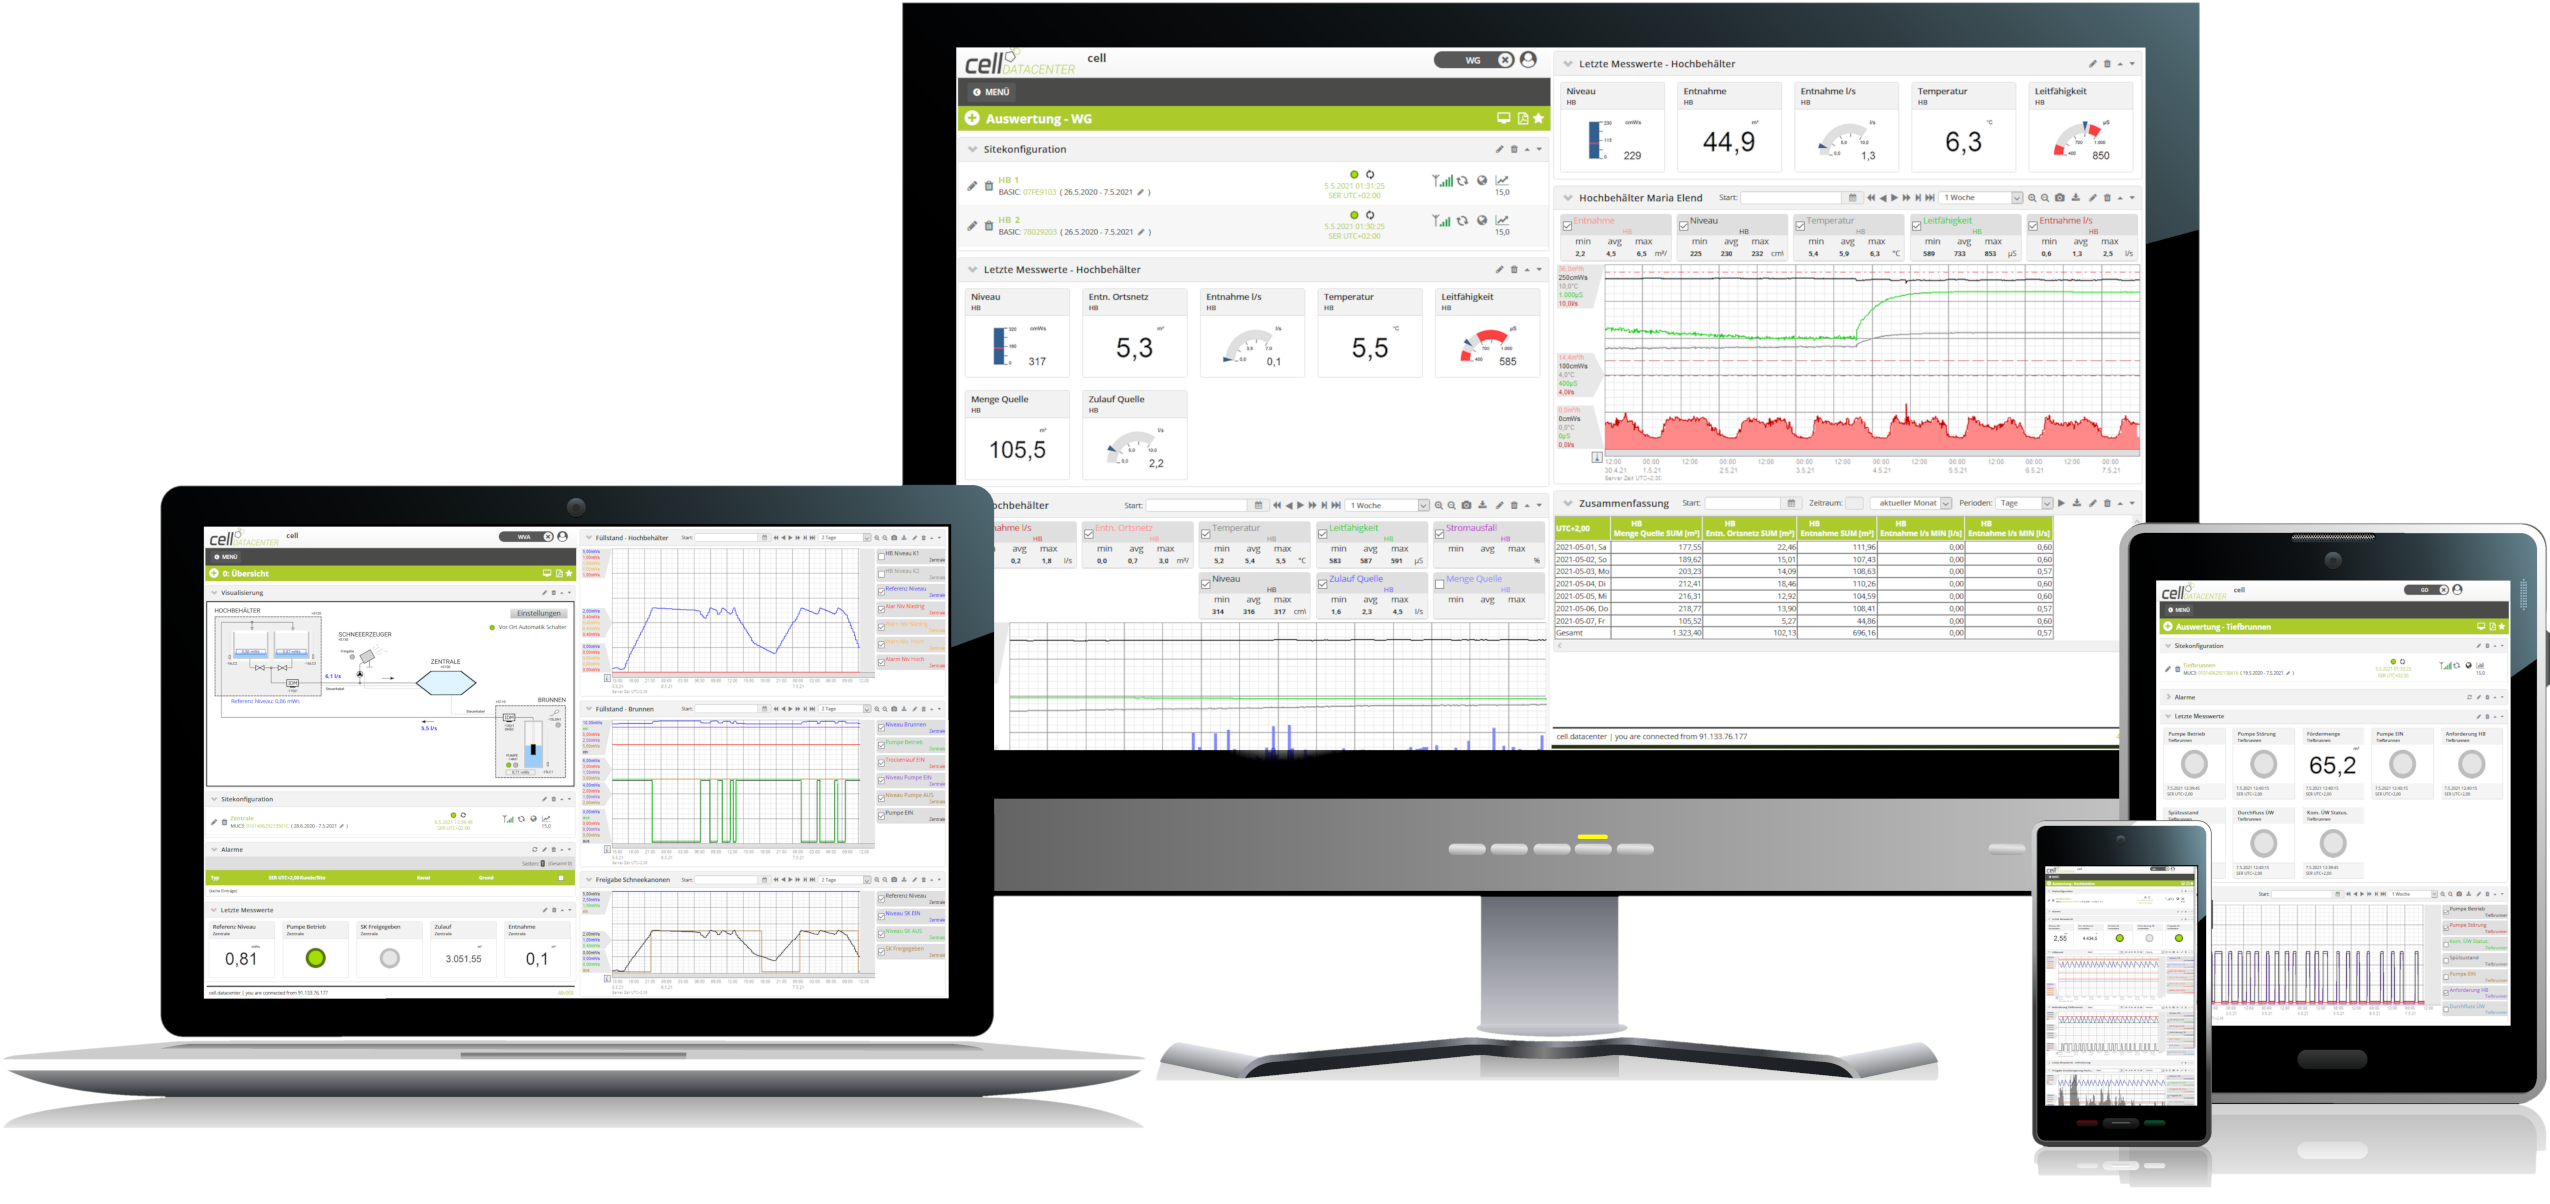
The items show the latest process data and therefore the current system status and are available in a variety of formats.

Line charts
- Your history data is visualised with highly dynamic handling options.
- Tools such as pan, zoom, jump or the section bars ensure efficient navigation through your recorded datasets.
- Integrated data analyses quickly provide a statistical overview of the displayed data.
- Leave comments directly in the diagram for traceable documentation of measures taken.

Bar charts
- Like the line chart, they visualise historical datasets and clearly display water quantities or operating hours.
- Of course, line and bar charts can be combined in one diagram.

Integrated data export
Creates an image file from a diagram for documentation or outputs data in a standard Excel format for further processing

Evaluation tables
Used for reporting and summarising data. The dynamic selection of time periods and intervals make the analysis tables a very valuable tool.

Schematic with actual values
- Interactive schematics provide you with a maximum overview of the current process data and the technical plant.
- Control elements can be used to send control commands.
- Dynamic graphics show tank levels and well water levels.
- By clicking on the respective graphic, the system navigates you to further reportings

Map
The map view provides a compact overview of a large number of stations. It shows the status of the stations as well as a summary of the latest measured values.

Comments and operations diary
- Possibility of documenting maintenance and carried out measures in reportings and charts.
- Important information is no longer lost

Integrated documentation
Save circuit diagrams, certificates, operating instructions and photos in the integrated document storage system.

Automatic PDF reporting
Automatically receive reports in pdf format by e-mail at a selectable interval.